
With last year’s long and hot summer not yet forgotten, it will not come as a surprise that 2018 was a good year for the owners of PV systems. But how does this year relates to previous ones? What does it mean for the long term performance of PV systems? Autarco’s engineers collected the data and found out.
What was the influence of the long summer?
In a previous blog on this site, we already saw that February 2018 was a very sunny month, related to other Ferbruary months. But the graph below also shows that this is of little impact on the year’s total yield, since it is only a small part of it. Of course, it’s the summer months that count. Typically, in the Netherlands you will generate 40 to 45% of a total year’s yield in May, June and July, when the days are longest and the sun is high in the sky. In 2018, these months were particularly sunny and warm, pushing the total irradiance for 2018 to values 8 to 15% above the long term average.
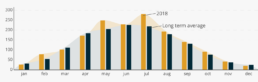
Average irradiance per day (W/m²)
15% more irradiance, what’s the deal?
The next graph shows the yearly irradiance for five locations in different parts of the Netherlands. First thing to notice is the year to year deviation. It also shows that 2018’s high irradiance levels are quite rare, we need to go back fifteen years to find similar values. As an installer or (potential) owner of a PV system, it might be tempting to consider yourself well off, based on last year’s yields. But it’s because of these deviations in the graph, that last year’s peak irradiance gives us no information whatsoever for the coming years. Therefore it is of great importance to keep looking at long term averages, in order to obtain realistic expectations on yields.
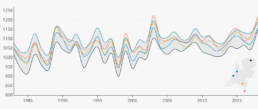
Total yearly irradiance (kWh/m²)
So what does this mean for my PV system?
In terms of the yield of any PV system, the irradiance alone does not tell the complete story. Sure, it’s important, but yield is also affected by the pitch and azimuth of the modules, the system’s efficiency and shade losses.
Autarco’s design and monitoring software has all the answers. By modelling a PV system, an exact virtual copy is created, where all the yield influencing aspects as described before are taken into account. Based on the design a yield prognosis is calculated, using the long term average irradiance for the exact location of the system. This makes it possible to very accurately calculate the return on investment for any PV system, and is much more secure than the standard figures still used to estimate yields in terms of kWh per kWp. After all, these numbers do not tell the whole story and are often too high.
After installation and registration of an Autarco PV system, the installation is verified to be sure that it is exactly similar to its virtual twin. By doing so, Autarco is able to monitor performance on all of its systems with great accuracy. We don’t look at standard figures and estimates whatsoever, based on the virtual twin and the actual meteorological satellite data, we know exactly what a system’s yield should be at any time. By comparing this with the actual yield as communicated by the inverters, we know immediately when something’s wrong and maintenance or repairs should take place.
Find out more on our design software here.