
All about arc faults
Introduction
The risk of fire caused by solar systems is very low and in the vast majority of cases caused by low quality products or installer error that leads to an electrical arc and then fire. The chance of a fire being created by an arc in your solar system is comparable to the same risk carried by most electrical appliances such as a toaster.
Despite this low risk, at Autarco we have taken all possible steps to reduce the likelihood and impact of any threat to the safety of those under your roof. As a total solutions brand, we are in position to control these risks far better than a brand that only produces one product like a solar panel manufacturer or solar inverter manufacturer.
Read on to find out more.
What is an arc fault?
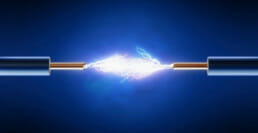
- An arc is formed by separating two parts of a circuit where a current is running. A plasma is formed between the 2 parts emitting light and heat.
- The plasma is good conductor, so in other words the current will keep flowing and the arc will continue until one of below;
- The voltage in the circuit is reduced to less than 12V
- The distance between the 2 parts is closed.
- The distance between the 2 parts is increased far enough to break the arc.
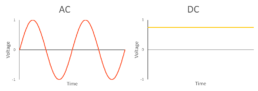
- In a solar system, the rooftop current is a direct current which makes arcs more troublesome than in an AC circuit where the voltage goes to zero (50-60 times in one second, according to the grid frequency).
- The large energy produced by arcs can be controlled in certain industrial applications such as welding and plasma cutting and they are also commonly used in lighting applications.
- If uncontrolled, the hot plasma may cause damage and will cause plastic parts to melt and potentially cause fire..
Possible causes of an arc in a solar system
There are numerous connection points in a solar system that are potential flash points for electrical arcs to occur. You can think of these points simply as switches and plugs.
Plugs:
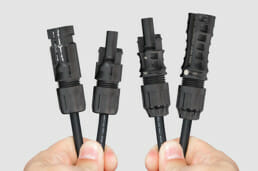
- Individual solar panels have connectors (plugs) on the end that are joined together. The ones that come on Autarco solar panels are installed in highly automated production lines with stringent quality control. The installer just needs to make sure they hear a “click” when they connect the plugs and then the risk is incredibly low.
- The connectors on the cable that connects the panels on the roof to the inverter on the ground are added by the installer and this introduces three risks;
- Choice of low quality product
- Mismatch with different connector brand
- They do not add the connectors to the cable properly with the correct tools.
As a total solution brand, Autarco provides all connectors of the same brand to our install partners.
Switches
- Some form of DC switch (also referred to as DC Isolator) is mandatory at the solar inverter, so the inverter can be safely disconnected from the solar panels for maintenance or replacement.
- When an installer is not suitably trained or is trying to save costs they may install an external switch that is not suitable for the solar system which can result in arcs.
- Beyond incorrect product choice, the connections in the external switch may also be poorly done.
Autarco inverters have an integrated DC switch, so they are always properly matched and installed under strict quality control.
External Causes
- Animals chewing through wires can also lead to arcing.
Prevention
Prevention beats detection every time. That’s why we have deployed innovative technologies and processes in our total solutions to mitigate the three main causes of unsafe situations.
- Product Quality
- Design Safety
- Install Quality
You can read more about this on our safety page.
Detection
In addition to our prevention measures, all Autarco inverters are now available with inbuilt Arc Fault Detection. This means that the inverter can detect an arc in line and will then shut down and send an alarm.
The detection in Autarco inverters conforms with UL1699B-2018, which is an American standard, but is currently the only available standard for arc fault detection in the world. As new standards (The Europeans are working on one now) become available, our inverters can be upgraded to comply with them.
Additionally, if the system is fully deployed with optimizers it is possible to reduce voltages of all panels on the roof to zero. This additional feature is required due to the previously mentioned DC circuit in solar panels, if the sun is shining there will still be a voltage between the panels, so the arc may not be extinguished by inverter shutdown.
In summary, an Autarco total solution protects those under your roof better than any combination of component brands. We make the safest solar PV systems in the world.
Are Autarco modules bankable?
Yes, Autarco modules are bankable. ABN Amro, Triodos, ASN and most major banks in The Netherlands are willing to finance projects using Autarco’s products. If this isn’t the meaning of bankable, then what is?
We could end there and have the shortest blog post ever. However, we are aware that our proposition is different to other component brands and are happy to explain more. Autarco handles product risks and product quality better than any component brand and we can back that claim up with reports from independent and well recognized companies in the industry as well as historical system performance data.
We are very proud of our approach to manufacturing high quality and reliable products and have nothing to hide.
What is our manufacturing approach?
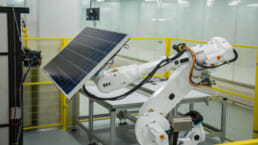
Autarco does not own any factories ourselves. We have our own designs and specifications that are tighter than the industry standard and then contract the best factories in the market to manufacture these products on our behalf. This is a modern approach to manufacturing that is the standard in many industries more mature than the relatively young solar PV industry. Good examples are the electronics and automobile industries where brands work with a variety of specialized component manufacturers and themselves focus on design, assembly and service.
This approach not only allows us to deliver exceptional levels of quality and reliability, but also gives greater flexibility in rapidly changing markets, such as the solar market we are in.
Where do we produce our products?
Our MHE Series modules are produced by Chint, a global electronics giant with annual revenues greater than US$10bn. Founded in 1984, Chint has developed a business network in over 140 countries and regions with more than 30,000 employees. Chint’s solar brand Astronergy is one of the most recognized brands in the market and is regularly featured in:
- DNV GL Top Performer in all tests (Thermal Cycling / Damp Heat / PID).
- Bloomberg Tier 1 lists.
How does solar panel production actually work?
Typically products are defined and produced as follows:
- A single certified product code relates to a set of endorsed components (cells, backsheet, glass, etc.) called a Constructional Data Form (CDF) or simply a Bill of Materials (BOM).
- For each component in the solar panel there is a range of certified suppliers of higher and lower quality, meaning it is possible to have different levels of quality within the same product code. Without proper control, buyers should assume they will get the most convenient (cheapest) option.
- The certificate will also list a number of allowed factories. Many of the other “OEM” factories are smaller locations with poorer quality equipment, lower automation and looser quality control than the main factory. Even within the main factory, different production lines will often have different levels of automation and equipment age.
- The module will have a production process with criteria for each step with regards to tolerances that are acceptable. This defines among other things the number and length of micro-cracks that are allowed before a module is deemed to be defective.
So when you buy a solar panel from a factory or third party without knowing the exact BOM, production location and quality specifications you may be receiving an inferior product to one that the same brand would use in their own projects. Component brands know they can get away with delivering cheaper versions to the rooftop/distribution market and as long as there are no massive failures, lower performance will have no consequence for them.
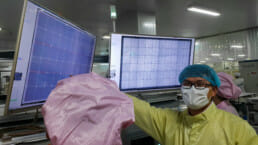
How does Autarco manage quality
Autarco has a stake in the performance of all of our systems so we do everything possible to control quality:
- We restrict the components used to a specified BOM of only the best components.
- We only allow production on the most advanced production lines.
- We enforce higher quality specifications than industry standard.
In this manner, an Autarco module is not just identical to any other module produced by Astronergy, it is in actual fact likely to be of superior quality. To give two concrete examples with the MHE series (without going into nerdy quality assurance details):
- We only use the superior original Staubli MC4 on our modules, while Astronergy normally uses an MC4-like connector.
- We have tighter dimension tolerances than Astronergy normally applies, to remove inconvenient gaps in the middle of the modules and issues during installation.
- We apply stricter cell sorting to ensure a more aesthetic module.
We have third party audit and quality reports available on request if required.
What about warranties and guarantees?
At Autarco we believe intensely in the benefits of our total solution approach with insured performance guarantees. A performance guarantee that financially compensates when the system is underperforming is far more meaningful to rooftop solar owners than the solar panel component warranties, but any system performance guarantee we offer is always in addition to all the industry standard solar panel warranties, including:
- 10 year product warranty
- 25 or 30 year power output guarantee
Our agreements with Chint have the following statements;
“Chint declares hereby that all PV modules produced for Autarco Group BV or any of its subsidiaries are covered by the Chint “Limited Product Warranty” and 25 year “Limited Peak Power Warranty” terms on which you find enclosed.
The above means that, in case Autarco Group BV is no longer actively trading, any warranty claim against a faulty PV module manufactured by Chint for Autarco Group BV or any of its subsidiaries will be honoured by Chint as per the “Limited Product Warranty” and 25 year “Limited Peak Power Warranty” terms provided that it is a proven product defect.”
The solar panel Warranties are also fully insured by Munich Re or Lloyd’s of London.
The Dealer and end customer in effect receive four different levels of security on the warranties:
- Autarco: Primary and EU based cover
- Chint: Underwrite Autarco product warranty
- Product Warranty Insurer: Underwrite Chint product warranty
- kWh Guarantee Insurer: Underwrite Autarco kWh Guarantee
Conclusion
Our manufacturing approach means Autarco will never be listed in the Bloomberg Module Tier 1 list ourselves as one of the requirements is to own the factory. However, the Autarco MHE Series module is at least as good as the Astronergy modules on the list. Bankability is a measure of a banks willingness to finance a project and we have never experienced a bank unwilling to finance an Autarco project, conversely, our partners have typically been able to lend at lower rates thanks to the security provided by our insured performance guarantees.
In short, yes, Autarco modules are bankable.
Important details regarding Tigo optimizers
Solar panels can’t always be installed with the ideal layout, sometimes shading of buildings and trees in the near vicinity can cause lower yield than expected. We supply optimizers from Tigo to reduce yield loss thanks to shade. This solution allows you to install an optimizer on either one or more solar panels per string. Visit the Tigo website for important recommendations regarding which combinations are possible and what to look out for when designing a PV layout.

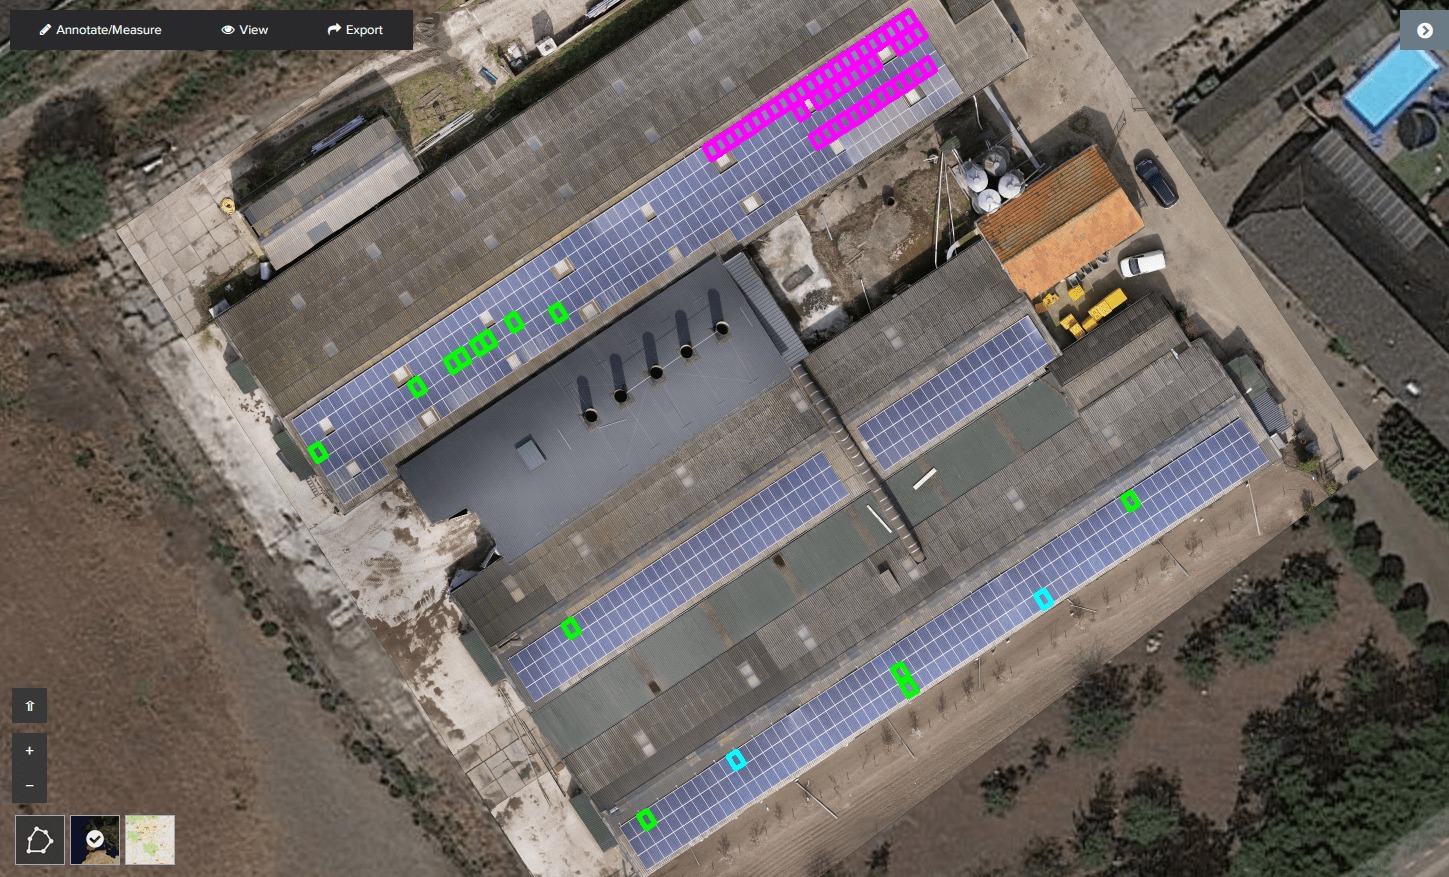
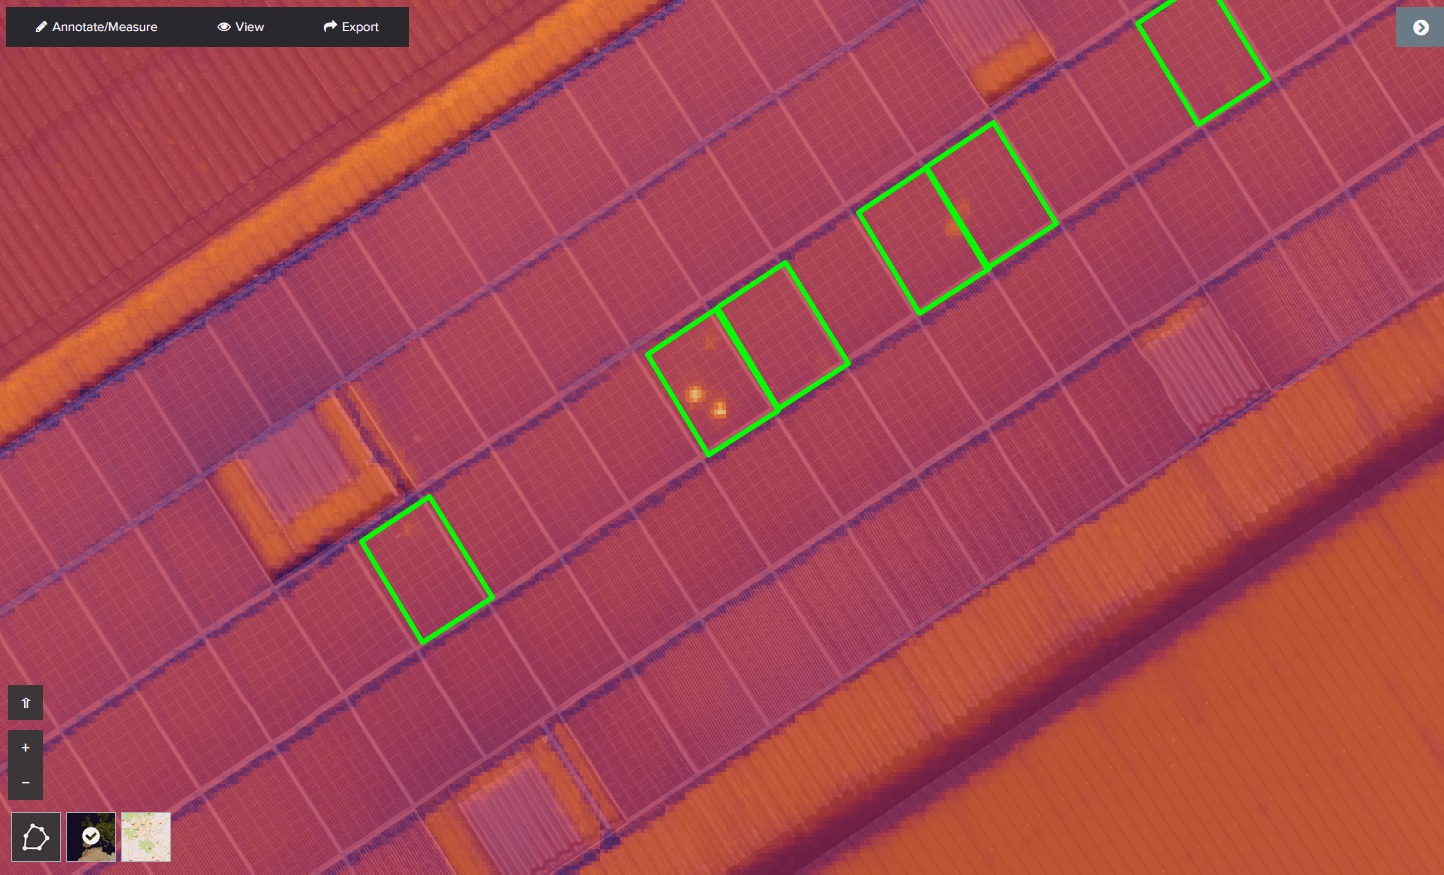
Autarco leading the industry through drone aerial thermography
Autarco has initiated an industry-leading project designed to enhance the delivery of optimal performing solar systems. Together with Dutch Drone Company, O-Nexus and support from RVO, the project will provide new insights and tackle one of the biggest issues in the solar industry.
Why use drone-based aerial thermography?
As a company committed to innovation and digitisation of the industry, Autarco has been an early adopter of drone-based aerial thermography and is now seeking to maximise this new technology to its full extent.
This project will provide additional data to help deliver two improvements to our software through advanced data analytics and machine learning.
- Improve performance loss model
- Improve monitoring-based detection of defects
Advanced monitoring of solar performance
When an Autarco Authorized Dealer designs a system in our free software, a digital twin is created of your actual solar system. By using real-time satellite irradiance (sun levels) and temperature data, we calculate expected performance of this digital twin and compare it to the actual production of your system. If there is underperformance detected, quite often it is to do with vegetation growth, soiling or inverter failure. Occasionally underperformance may be caused by a defect in the solar panel which is far more difficult to detect and diagnose remotely.
In addition to being able to detect system underperformance this way, we can also detect anomalies in the monitoring data. The monitoring data we receive from your system includes the DC voltage and current data of each group of modules on your system. Using this we can already detect certain types of defects. A near perfect understanding of system design (e.g. stringing) and shade conditions is required to achieve an acceptable level of accuracy for this type of detection.
Autarco is one of very few companies who can achieve this, thanks to the digital twin and our integrated total solution approach.
How aerial thermography benefits our advanced monitoring
We want to improve our advanced monitoring even further. To achieve this we need more data to validate our models and calculations.
1. Improve performance loss model
If drone aerial thermography tells us that there are certain anomalies found, we want to be able to say with certainty what type of performance losses these anomalies are causing in the full system. There is no one in the industry who is currently able to do this reliably.
2. Improve monitoring-based detection of defects
If we can continue to improve the intelligence of our software in the future, we might not even need to use the drones to take the aerial thermography images. We can potentially fully detect and diagnose the defects in the solar panels entirely through our advanced monitoring data.
Drone flights are starting now. We are excited about the possibilities of this project and will share our findings with you as soon as they become available.

A performance boosting summer
With last year’s long and hot summer not yet forgotten, it will not come as a surprise that 2018 was a good year for the owners of PV systems. But how does this year relates to previous ones? What does it mean for the long term performance of PV systems? Autarco’s engineers collected the data and found out.
What was the influence of the long summer?
In a previous blog on this site, we already saw that February 2018 was a very sunny month, related to other Ferbruary months. But the graph below also shows that this is of little impact on the year’s total yield, since it is only a small part of it. Of course, it’s the summer months that count. Typically, in the Netherlands you will generate 40 to 45% of a total year’s yield in May, June and July, when the days are longest and the sun is high in the sky. In 2018, these months were particularly sunny and warm, pushing the total irradiance for 2018 to values 8 to 15% above the long term average.
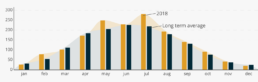
Average irradiance per day (W/m²)
15% more irradiance, what’s the deal?
The next graph shows the yearly irradiance for five locations in different parts of the Netherlands. First thing to notice is the year to year deviation. It also shows that 2018’s high irradiance levels are quite rare, we need to go back fifteen years to find similar values. As an installer or (potential) owner of a PV system, it might be tempting to consider yourself well off, based on last year’s yields. But it’s because of these deviations in the graph, that last year’s peak irradiance gives us no information whatsoever for the coming years. Therefore it is of great importance to keep looking at long term averages, in order to obtain realistic expectations on yields.
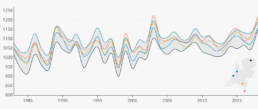
Total yearly irradiance (kWh/m²)
So what does this mean for my PV system?
In terms of the yield of any PV system, the irradiance alone does not tell the complete story. Sure, it’s important, but yield is also affected by the pitch and azimuth of the modules, the system’s efficiency and shade losses.
Autarco’s design and monitoring software has all the answers. By modelling a PV system, an exact virtual copy is created, where all the yield influencing aspects as described before are taken into account. Based on the design a yield prognosis is calculated, using the long term average irradiance for the exact location of the system. This makes it possible to very accurately calculate the return on investment for any PV system, and is much more secure than the standard figures still used to estimate yields in terms of kWh per kWp. After all, these numbers do not tell the whole story and are often too high.
After installation and registration of an Autarco PV system, the installation is verified to be sure that it is exactly similar to its virtual twin. By doing so, Autarco is able to monitor performance on all of its systems with great accuracy. We don’t look at standard figures and estimates whatsoever, based on the virtual twin and the actual meteorological satellite data, we know exactly what a system’s yield should be at any time. By comparing this with the actual yield as communicated by the inverters, we know immediately when something’s wrong and maintenance or repairs should take place.
Find out more on our design software here.
Wat betekent een goede zomer voor mijn jaaropbrengst?
Met de lange, warme zomer van het afgelopen jaar nog vers in het geheugen zal het geen verrassing zijn dat 2018 een goed jaar was voor de eigenaars van PV-systemen. Maar hoe verhoudt dit jaar zich tot eerdere jaren? En wat betekent dit voor de prestaties van PV-systemen op de lange termijn? De engineers van Autarco verzamelden de data en zochten het uit.
Hoeveel invloed had de lange, warme zomer?
We hebben in een eerdere blog al gezien dat februari naar verhouding een behoorlijk zonnige maand was afgelopen jaar. Tegelijkertijd maakt de onderstaande grafiek duidelijk dat de impact hiervan klein is, de grootste opbrengsten worden immers niet gehaald in februari, maar in de zomermaanden. Gemiddeld genomen wordt in Nederland circa 40-45% van de jaarlijkse opbrengst behaald in de maanden mei, juni en juli, wanneer de dagen het langst zijn en de zon het hoogst aan de hemel staat. Deze maanden waren vorig jaar uitzonderlijk zonnig en warm, waarmee de totale instraling voor 2018 maar liefst 8 tot 15 procent hoger ligt dan het langjarig gemiddelde.
Gemiddelde instraling per dag (W/m²)
15% meer instraling, hoe bijzonder is dat?
De volgende grafiek toont de jaarlijkse instraling voor een aantal locaties in Nederland. Hieruit wordt direct duidelijk dat deze waarden van jaar tot jaar behoorlijk variëren. Ook blijkt dat de hoge instraling van vorig jaar niet vaak voorkomt, het is vijftien jaar geleden dat we voor het laatste dergelijke waardes zagen. Het is misschien verleidelijk om je als installateur of (potentiële) eigenaar van een zonnestroomsysteem rijk te rekenen op basis van de hoge opbrengsten van afgelopen jaar. Maar vanwege de schommelingen in de grafiek zegt de piek van 2018 niets over de te verwachten opbrengsten in 2019. Het is daarom belangrijk om naar een langjarig gemiddelde te kijken om een realistisch beeld te krijgen van de verwachte opbrengst van een PV-systeem.
Totale jaarlijkse instraling (kWh/m²)
Wat betekent dit voor mijn PV-systeem?
Een hoge instraling zegt natuurlijk niet alles over de prestaties van een systeem, deze worden immers ook beïnvloed door de hellingshoek en oriëntatie van de panelen, de efficiëntie van het systeem en verminderde opbrengst door schaduw op de panelen.
De ontwerp- en monitoringsoftware van Autarco biedt uitkomst. Met het modelleren van een PV-systeem wordt een exacte virtuele kopie gecreëerd, waarin alle hierboven benoemde aspecten worden meegenomen. Op basis van het ontwerp wordt een verwachte opbrengst berekend, die uitgaat van de langjarige gemiddelde instraling voor exact de locatie van het systeem. Dit geeft een zeer accuraat beeld van de te verwachten baten van de investering en biedt veel meer zekerheid dan de kengetallen waarmee opbrengsten geschat worden, in termen van kWh per kWp. Deze vertellen immers niet het gehele verhaal en zijn vaak aan de hoge kant.
Na installatie en registratie van een Autarco PV-systeem wordt de installatie geverifieerd, om er zeker van te zijn dat de fysieke installatie identiek is aan zijn virtuele kopie. Op deze manier kan Autarco zeer nauwkeurig de prestaties van al haar systemen monitoren. We kijken immers niet langer naar rekenwaardes en kengetallen. De combinatie van het ontwerp in de software en het gebruik van actuele satellietdata zorgt ervoor dat we exact weten wat een systeem zou moeten opwekken. Door dit te vergelijken met de monitoringgegevens van het systeem, weten we direct wanneer een systeem minder presteert dan verwacht en er onderhoud of een reparatie uitgevoerd dient te worden.
Meer over onze ontwerpsoftware vindt u hier.
Operations & Maintenance for rooftop solar
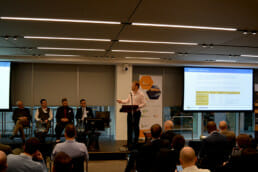
The Operations & Maintenance (O&M) Best Practices Guide Version 3 was released last week at the annual O&M and Asset Management Conference in London. The latest version, developed by Solar Power Europe together with industry experts, now includes a chapter on distributed solar of which Autarco is very proud to be the leading author. The Guide is an excellent resource and we highly recommend all of our Dealers to take the time to read it carefully. O&M is not only critical to guarantee the long term performance of systems, but is also a huge opportunity for Dealers to develop long term relationship with their customers and generate stable and recurring revenue.
Recognition of Autarco's industry leadership.
The Guide covers key topics such as;
- Key Performance Indicators
- Recommended Response Times
- Innovations and Trends
In recognition of the hard work and expertise provided by Autarco in the development of this chapter, our CFO, Dan Horan, was invited to make a keynote speech to introduce the new chapter. He explained during his presentation, “In the utility sector, asset owners are professionals who are knowledgeable about the risks of solar and have assistance from independent engineering, legal and insurance experts. As a result manufacturers, EPC’s and O&M suppliers are held accountable over the full 25-30 year life of a system. In contrast, distributed/rooftop system owners are preoccupied with other matters and don’t necessarily know the first thing about solar. This is made worse by the traditional distributed supply chain which involves a flow of individually branded components that flow through distributors, installers and then finally to the system owner. In most cases the risk and complexity flow down with the components and accumulate with a system owner who is ill-equipped to deal with them and often forgotten after installation.”
Best practises maximise return on investment.
One of our primary purposes at Autarco is to simultaneously remove that risk from both the system owner and the installers. We do this by remaining a stakeholder in the systems performance:
- Being accountable for the quality and performance of our products.
- Providing the necessary tools to our Partners to ensure the system design, install and financial modelling is done to the highest standard with the highest ease.
- Providing intelligent operations (monitoring, alerting and diagnosis) and asset management (reporting) software to our Partners to enable them to easily provide maintenance services (or outsource if preferred).
- Insuring the risk of lower irradiance and product defects
“You can’t guarantee long term performance of the best products in the world without taking long term care of them.”
Dan Horan – CFO Autarco
In partnership with our dealers.
We have complete confidence in the quality of our products, we know our partners do a great job on install and design, the final piece is to make sure long term operations and maintenance is done to the same high standards. As Horan states “You can’t guarantee long term performance of the best products in the world without taking long term care of them”. Together with our Dealers we can provide the same level of security and profitability that utility asset owners demand to our rooftop customers. Of course, if Dealers only want to install we can arrange another O&M provider to take over this responsibility.
If you are a solar installer who wants a full service end-to-end hardware and software solution that improves your bottom line, while offering your customers the best proposition in the market please get in touch with us today.
The argument for now
The installed price of solar PV systems has decreased by an incredible 70% over the past 5 years, leading many potential solar owners to question whether they should invest now or wait for further price decreases. The answer for potential beneficiaries of the Dutch SDE+ program is clear; there is no better time than now.
Install costs in solar are decreasing...
The increased price competitiveness has driven the solar industry to record installations in 2017 of a massive 80GW compared to 20GW in 2012. As a result, solar is now at grid parity in many parts of the world and we even see solar projects breaking ground in regions where there are additional taxes applied on solar as opposed to supporting subsidies. This is undoubtedly brilliant news, but it also gives rise to a common question asked by end customers; “If the price decreases so rapidly, why should I invest now? Isn’t it better for me to wait until solar is even cheaper and then invest?” There is sometimes strong merit in this argument and it can only be answered on a case by case situation per market.
“Value of SDE+ Payments decreases over 40% in 3 years”
... but so is the SDE+ subsidy.
For the Dutch market however, particularly the commercial SDE+ market, the answer is a resounding “DO NOT DELAY”. Potential owners should be absolutely utilising any SDE+ subsidy allocated or making the effort to apply during the current Autumn 2018 round due to close in October. Even considering the urgent need for everyone, individuals and businesses alike, to take action in reducing CO2 emissions to limit global warming, there is a purely economic decision to act now: acting now maximizes the lifetime returns of your solar system.
There are 4 primary factors that determine the financial performance of any solar system over a 15 year investment window. You can of course perform the same analysis over 20 or 30 years if desirable, but for the purpose of this article we take the 15 year subsidy period.
| SDE+term | SDE+rate | Self-consumption correction | Change from year 1 | Deadline |
|---|---|---|---|---|
| 2015 | € 0.096 | no | – | Signed contract within 1 year, commissioning within 3 years |
| Spring 2016 | € 0.084 | no | -12.5% | Commissioning within 3 years |
| Autumn 2016 | € 0.084 | no | -12.5% | Commissioning within 3 years |
| Spring 2017 | € 0.092 | no | -4.2 | Signed contract within 1 year, commissioning within 3 years |
| Autumn 2017 | € 0.084 | no | -12.5% | Commissioning within 1.5 years |
| Spring 2018 | € 0.062 | yes | – | Commissioning within 1.5 years |
| Autumn 2018 | € 0.056 | yes | -42.2% | Commissioning within 1.5 years |
*The SDE+ rates in this table assume the highest price brackets and standard correction rates as published by RVO. In the case of the 2018 subsidy, a self use percentage of 50% is taken into account. This number will differ between projects, but even with a theoretical self use of 0%, the maximum subsidy is lower than years before. We are looking at systems <1 MWp.
Why investments in solar should not be postponed.
These data demonstrate a compelling case to invest now! If you have a SDE+ subsidy already approved, the lost opportunity for letting this lapse in the hope of reapplying later when solar costs are lower is clearly a fallacy that is not going to turn out like you hope. Furthermore, with more parties stepping into solar, competition for SDE+ budget is getting harder, leading to smaller chances of getting your request for subsidy awarded.
Recent changes in the Chinese market have resulted in price reductions and further changes to the global supply-demand situation are possible in the coming months. We will soon cover these impacts on the European market, both negative and positive, following the final MIP decision and further clarity on tariffs in key markets like India, Turkey and the US. Even these product price decreases don’t compare with the opportunity cost of failing to act now.
Potential system owners who look at falling module prices and think waiting is the best option, can be convinced to act now by emphasizing three key points;
- Benefit and availability of SDE+ subsidy is decreasing at a faster rate.
- Improving global economics is already pushing interest rates higher. Increasing one of the major costs of any solar projects.
- We need climate action now.
If you have SDE+ customers who aren’t convinced or looking for something extra to convince them we are ready to help. Get in touch to offer a fully secured business case.
Do modules like this summer heat?
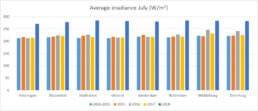
July was hot this year. Very hot. But this nice summer weather is good news for your solar modules, right? Or is it? In this article we look at the influence of these conditions on PV systems.
Due to the bright sun, at almost the highest point in its orbit and with hardly any clouds in the sky, irradiance reached record heights over the last couple of weeks. As shown in the graph below, in the Netherlands irradiance was 25-30% higher than the long term average.
So there was a lot of energy coming our way, ready to be harvested by solar modules. But this great irradiance comes with high temperatures, that surely didn’t go unnoticed. Tarmac was melting, bridges expanded until they wouldn’t open anymore, and crops drying out on the fields. The question now is, how do your PV systems react to this heat? Do they thrive under these conditions? Or are they taking it easy, as we humans tend to do?
Heat
It might sound counterintuitive, but where solar panels love the sun, the don’t particularly like the temperature coming with it. Solar modules are meant to convert light into electricity, not heat. To see exactly what this heat means for the yield of a PV system, we conducted a case study for an installation in our hometown Eindhoven. In this example, we are looking at a set of modules facing South, in an optimal 35° pitch. Looking into the meteorological data we collect on a daily basis, the average temperature in Eindhoven appeared to be around 3°C higher than the long term average. But because this higher ambient temperature is combined with the high irradiance and the heat generated by the modules themselves, it causes the average cell temperature to be 6°C higher than normal, easily reaching values as high as 60°C! This is bad news, because solar modules become less efficient in high temperatures, as do all semiconductors. Higher temperature means a lower potential difference within the cells, which results in lower voltages. And although the current might be a bit higher in situations like these, it doesn’t compensate the lower voltages, resulting in lower yields. After all, the output in watts is the product of voltage and current.
Effects
For our test case, irradiance for July was 34% higher than the long term average. At first glance you might expect yields to raise accordingly. Due to temperature losses, they don’t. The yield this month was only 30% higher, the difference being caused entirely by the high temperatures. As expected, this difference is higher than in previous years with their slightly milder summers. Usually, we look at a difference of around 1,5%, rather than the 4% for this year.
So yes, this sunny summer weather leads to higher yields for your solar modules. However, not exactly as high as you might expect. But while overall efficiency might be a bit lower, due to the high irradiance and the number of daylight hours, July will still be the best month of the year, as it is every year.
Temperature is only one of the many factors that influence the yield of a PV system. All of these values are taken into account in our design software, so it can accurately calculate the expected yields for any PV system. These exact calculations form a major part in Autarco’s insured kWh guarantee.
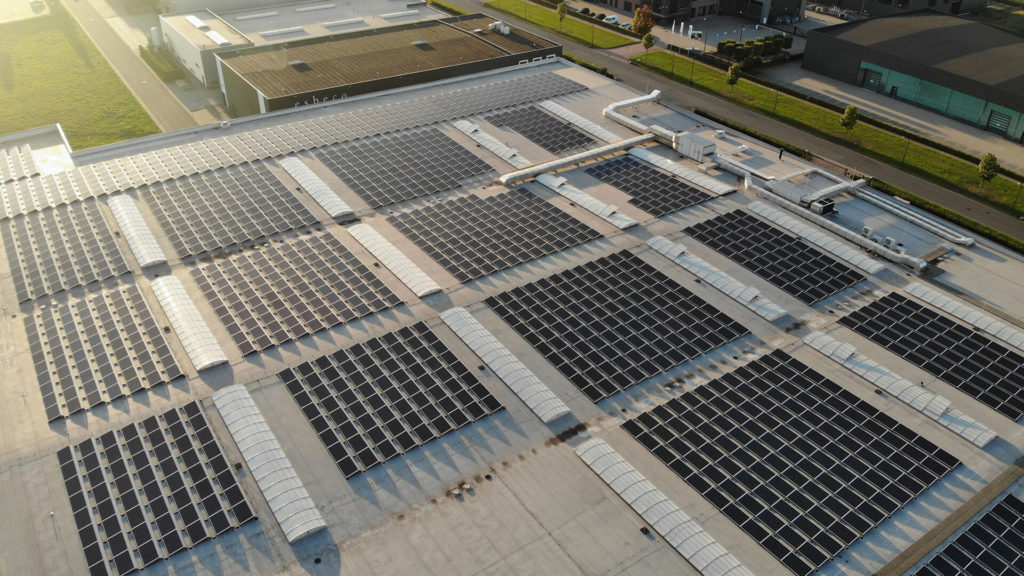
kWh Face Off! East-West Vs South
Every time a commercial flat roof PV system is designed a decision to build facing South or East-West must be made. While everyone knows European solar systems will perform best facing South with a decent sized pitch, there are a number of other factors at play that influence the most profitable solution for a commercial PV system owner.
Many analyses of East-West vs South facing PV systems for commercial projects still focus on year 1 costs (price per Wp) and estimated production. In the same way that we offer a kWh Guarantee that offers reduced risk and simplicity to installers and system owners, we believe the East-West vs South question is best considered looking at the returns on investment and the levelized cost of energy. After all, solar PV customers are not looking to solve a one-off component hardware problem priced in EUR/W, they are looking for a long term energy solution.
This long term energy solution needs to consider the total costs related to the yield of a system for its complete lifespan and of course the risk related to the solar production over the same lifespan. So what are the expected returns of a solar system?
Comparison.
Let’s look at an example where we compare both alternatives for a reasonably sized commercial project in the Netherlands. We cover some of the assumptions we have made in detail below.
Over the 15 year life of the Dutch SDE+ subsidy, the system owner can generate nearly 20% more profit with an East-West system at a slightly higher return on investment. While a south facing system in the Netherlands does produce nearly 7% more yield per Wp, this power is more costly given the current solar economics of 2018.
| Azimuth | Annual yield per kWp (kWh/kWp) | Annual yield per m² (kWh/m²) | Annual savings (€) | Cost of energy produced over 15yrs (€/kWh) | ProjectIRR * |
|---|---|---|---|---|---|
| East-West | 934 | 127 | 20,443 | 0.059 | 19.30% |
| South | 997 | 100 | 16,000 | 0.076 | 17.20% |
*IRR excludes any fiscal/tax benefits
Autarco’s insured kWh Guarantee lowers the risk profile of the project for the bank, helping system owners and investors unlock more debt at lower costs. As a result, the additional initial investment required for an East-West system should not be a barrier to completion.
The drivers behind this result and some of the key factors to consider are discussed below. Regardless of the choice, Autarco’s kWh Guarantee, insured by Lloyd’s of London, delivers peace of mind to both installers and end customers by providing a minimum production level that protects your investment.
Yield per wattpeak.
| Assumption: | Face Off result |
|---|---|
| Base Assumption: 10/12 degrees | Win for South. 7.3% more yield/Wp. |
| Factor: Greater module pitches | A 30 degree pitch south system will produce 13% more than a 10 degree pitch East-West system. |
As we all know, the yield per modules it at its best when the module is facing South. However, since the pitch of the solar panels in flat roof mounting systems is relatively low (10°-12°), the non optimal azimuth of East-West systems are more than compensated by other benefits.
Yield per m².
| Assumption: | Face Off result |
|---|---|
| Base Assumption: 10/12 degrees | Win for East-West. 22.5% more yield/m². |
| Factor: Spacing of South facing | Can reduce difference to around 8% if weight is not an issue. |
The yield per module might be a little less in East-West facing systems, the total number of installed modules outweighs this, leading to much better total yields per m² roof surface. This difference can be as much as 25%, so symmetrical systems are the way to go when roof surface is limited.
Impact of increasing pitch and reducing row spacing of South facing systems is offset by other issues such as shading and ballast requirements.
Yield distribution.
| Assumption: | Face Off result |
|---|---|
| Base Assumption: Low module pitch (10-15) | Marginal win for East-West |
| Factor: Greater module pitches | Makes East-West more competitive by increasing self consumption. |
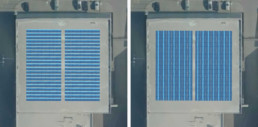
Another supposed advantage of symmetrical systems that is widely published is the distribution of yield over the day. Where a South facing system has a clear peak around noon, with solar panels facing East and West the yield is more evenly spread out. This results in a more steady production of kWh and a better match to the actual energy usage. However, the most common flat roof structures use a pitch between 10-15 degrees, so this advantage is really quite negligible as shown below.
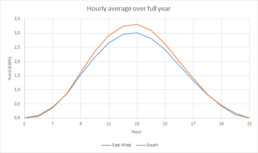
Because of the difference in azimuth, yield distribution differs over the course of a day.
Shade.
| Assumption: | Face Off result |
|---|---|
| Base Assumption: No Shade | Win for East-West |
| Factor: Morning or evening shade | Makes South more competitive. Morning or evening shade will result in greater shade losses for East-West facing modules |
When the modules are directly facing the sun they experience higher plane-of-array insolation – the amount of direct and indirect sunlight hitting the surface of the solar panel – which of course leads to higher yields. Since most shading occurs during sunrise and sunset, the general influence of shade is worse for symmetrical systems. Common rooftop obstacles such as air conditioning units and sky lights are easily capable of causing 5-10% shade losses for East-West systems if the PV array does not avoid appropriately and plan stringing accordingly.
The Autarco modelling software is designed to make exact shading calculations, making it possible to compare both alternatives on any given location.
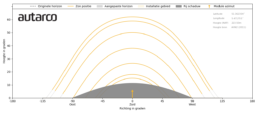
With modules facing south, there is a small amount of self-shading from one row to the next.
Mounting costs and ballast.
| Assumption: | Face Off result |
|---|---|
| Base Assumption: 10m roof height. | Clear win for East-West |
| Factor: Roof height or increase module pitch. | The higher roofs and greater pitches strengthen the East-West advantage. |
With a symmetrical (East-West) system, you make the most efficient use of the mounting system. Since there is hardly any space between the modules, there is no redundant mounting to be installed. Due to its nature of back to back modules, a symmetrical system is less influenced by wind loads. They form a closed system within itself, without the need to provide wind deflectors like South facing modules would need. You can save up to 15% on the costs for mounting when using a East-West facing system.
Apart from using less material per installed module, it saves on the need for ballast as well. This saves costs and labor, but more important, it lowers the total weight of a system, especially for roofs above 10 metres height. This can play an important role in the decision, mostly for industrial buildings where load bearing capacity of existing structures can be limited.
AC connection and other fixed costs.
Projects that have high fixed costs regardless of total system size also favour East-West systems. These could include things like;
- Grid connections
- Crane fees / scaffolding
Conclusion.
We hope you found this analysis interesting and useful. We are committed to making solar simpler and less risky for installers and owners of commercial PV systems. If you have any questions about how to choose the best solution for your project, please contact us.